

Tracking keywords make a lot of sense for SMBs and some mid-market businesses, but as we scale our content marketing we need to look beyond tracking a small set of keywords.
Clients want to see a birds-eye view of how their keyword set is performing. However, SEO professionals hadn’t really figured one simple way to achieve this using existing tools.
In this column, you’ll learn a BigQuery hack to track total rankings with Data Studio.
You’ll also get access to a free Data Studio template for visualizing BigQuery data. Ready? Let’s jump right in.
The Google Sheets Problem
Typically, I show clients the total amount of keywords they’re ranking for, broken out by position. Semrush’s organic research tool has a great visualization for this.
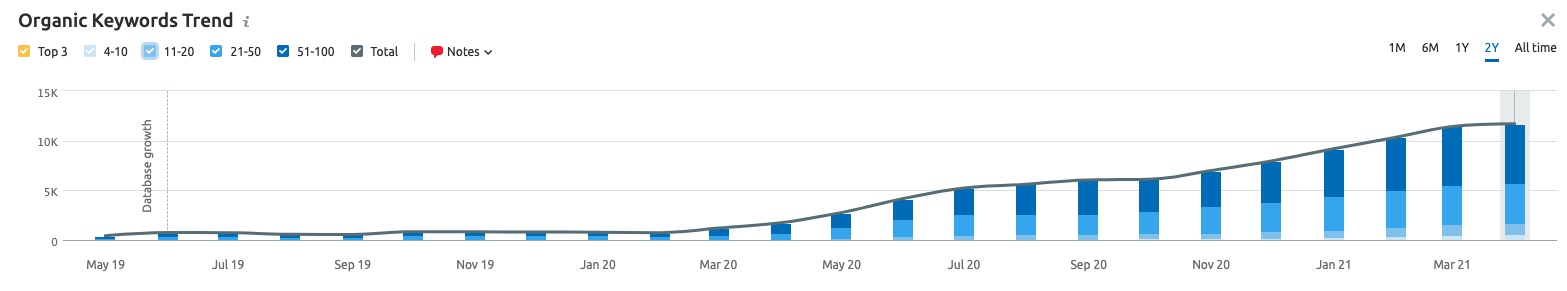
This chart can be filtered to show only certain positions and only certain sections of the site, which is useful.
However, this chart alone has many filtering and reporting limitations that could be solved through Data Studio.
Semrush and other SEO tools have similar charts and most of them connect to Data Studio. However, none of them have a chart in Data Studio that allows us to view all ranking keywords broken out by month.
They only let us see tracked keywords or currently ranking keywords for that given month.
SEO professionals have tried getting around this gap by downloading the new list of keywords every month and adding them to Google Sheets as their connector to Data Studio.
So what’s the problem with this?
Adding large sets of data to Google Sheets can take a very long time. Once you get to the hundreds of thousands of rows of data, Google Sheets may even freeze or crash your browser.
The biggest burden here is time.
The BigQuery Fix
BigQuery allows us to upload exported data without any modifications and sync that directly to Data Studio in a fraction of the time.
The downside is that you still currently have to export your total ranking keywords every month, but bypassing Google Sheets will end up saving a ton of time in the future.
Disclaimer: BigQuery has a paid component. However, it’s pennies until you reach a TB of data. The cost is nominal and very much worth the time lost waiting for Google Sheets to load, praying it won’t crash.
How to Setup Your First BigQuery Project
Getting started is quite easy. The only prerequisite is that you already have a Google account of some kind; even a Gmail will work.
I know working in the Google Cloud Platform can be pretty intimidating. There are a lot of advanced features and it’s not the most intuitive platform.
However, I’ve included a screenshot for every step of the process to help guide you through the setup.
If you get stuck, please don’t hesitate to reach out to me in the comments below.
1. Log in to Google Cloud Platform and Create a New Project
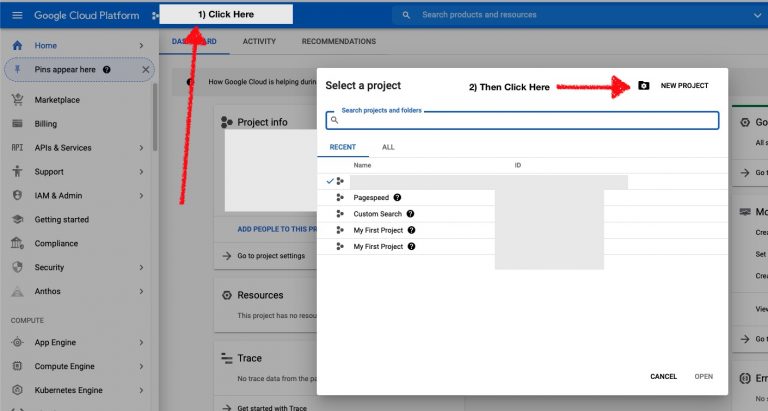
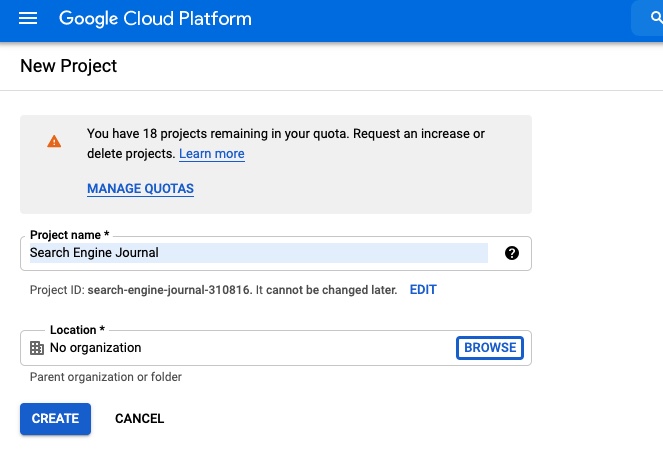
Go to Google Cloud Platform, create a new project, and assign a name and location.
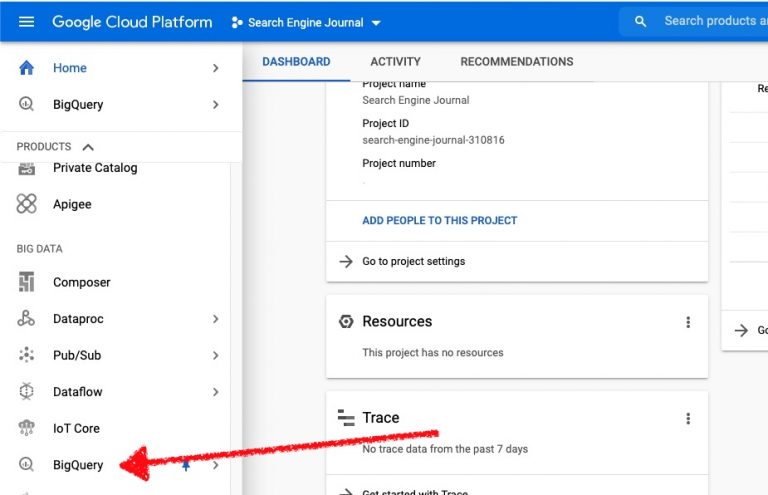
2. Go to BigQuery
3. You may need to set up billing if you haven’t done this already.
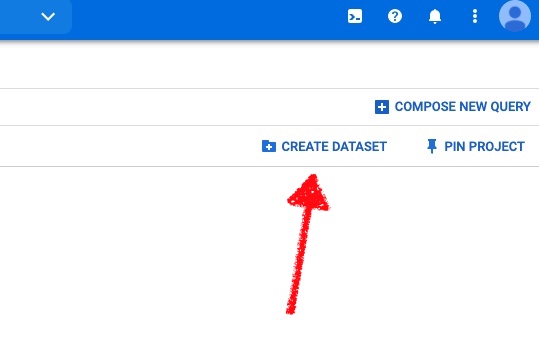
4. Once you’re ready to go, choose to Create Dataset.
A quick tip: this must contain only letters, numbers, or underscores.
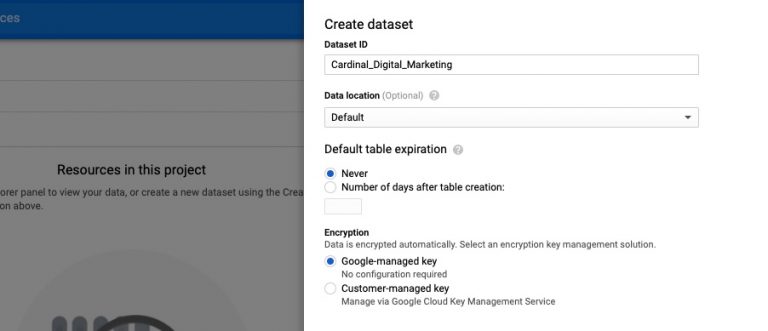
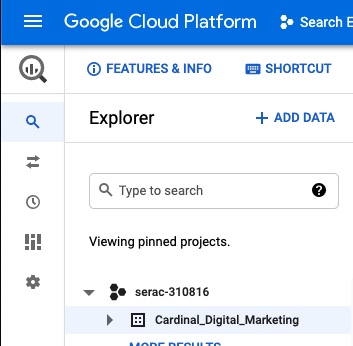
5. Go to new dataset.
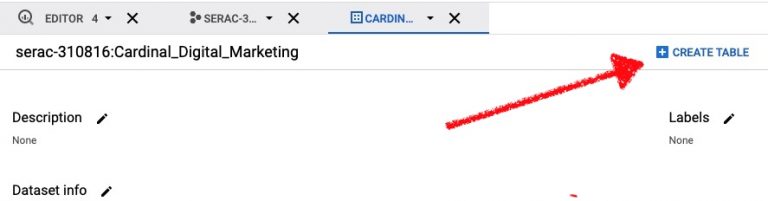
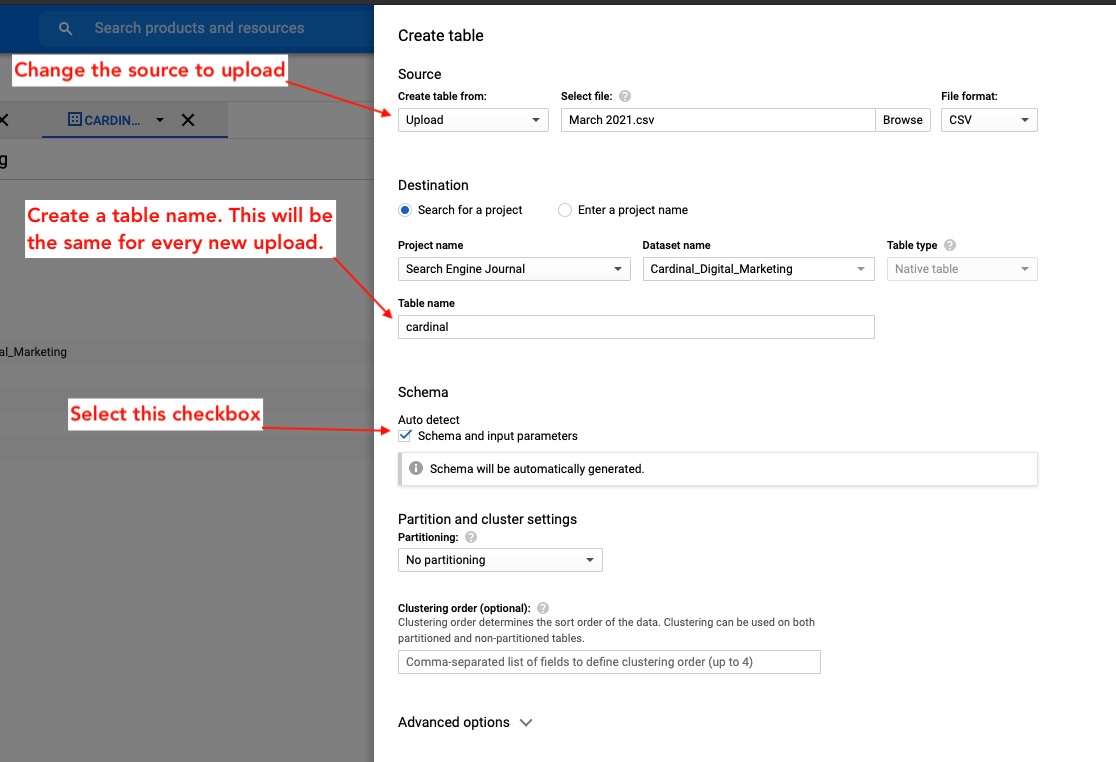
6. Create a new table:
Under source, change the “Create table from:” to Upload and select your CSV file. This should be your first set of keyword rankings.
Under Destination, give your table a Table name and make sure you use this same table name for every data upload. In the example below, I named my table “cardinal” but you can name your table whatever you want. I recommend using your website name so that it’s easy to identify later.
Under Schema, make sure to select the checkbox under Auto detect.
Select the blue “Create table” button at the bottom.
7. Now, you can add more data.
Select Create Table again.
Upload your second set of data. For example, if your first upload from Step 6 was February keyword rankings, this step you would upload March keyword rankings and next month you would follow these steps and upload April keyword rankings.
Under Destination, give your table a Table name and make sure you use this same table name for every data upload.
Under Schema, make sure to select the checkbox under Auto detect.
Select the blue “Create table” button at the bottom.
Important: Under Advanced options, for the write preference dropdown, select “Append to table.”
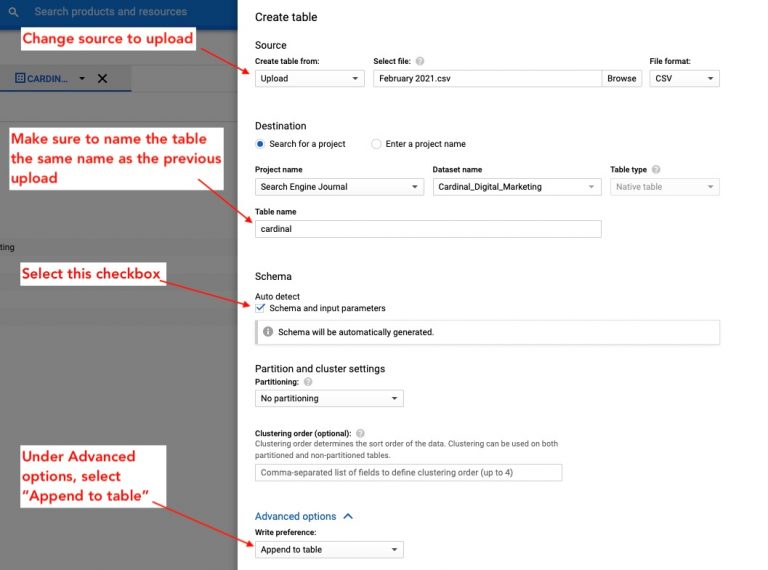
Repeat step 7 for every new month’s set of data.
Okay, the hard part is over!
Each month going forward, instead of uploading your data to Google Sheets, you can follow step 7 to update your data.
Free Data Studio Template to Visualize BigQuery Data
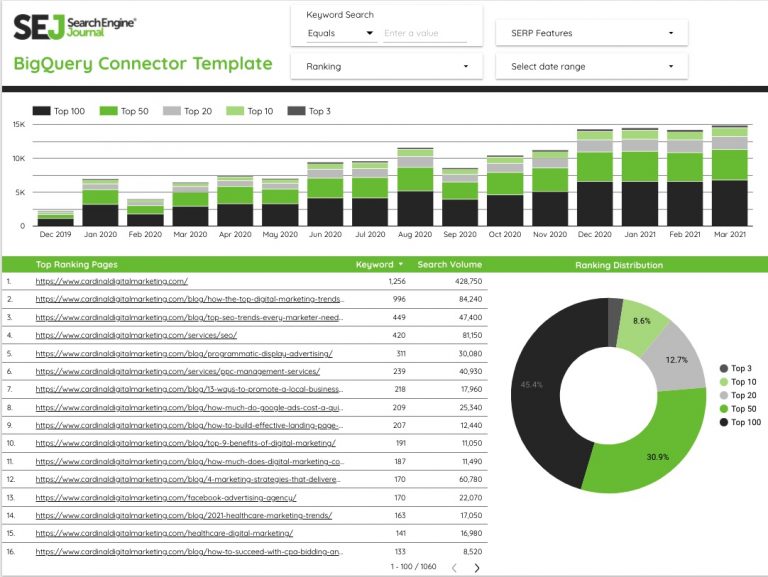
I’ve created a free Data Studio template that requires very little setup in order for you to get started.
Page one of the template includes the instructions below, but with screenshots. Feel free to skip straight to the template!
How to Setup the Template
Duplicate the report by clicking the duplicate button in the top right of the report.
You will need to create a new data source and connect it to your BigQuery project. Click “Create New Data Source.”
On the connection options, select BigQuery.
When adding the new data source, create a custom field to sort position distribution. This can also be done after you connect the data source.
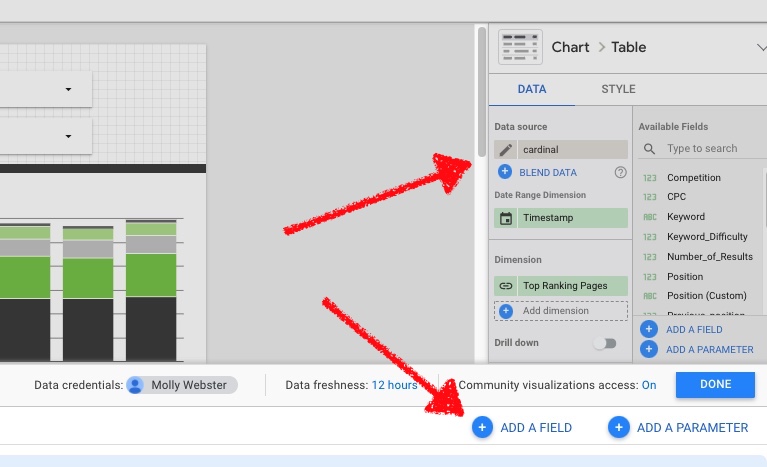
Name this field, “Position (Custom)” and copy the formula below into the field.
CASE
    WHEN Position <= 3 THEN "Top 3"
    WHEN Position <= 10 THEN "Top 10"
    WHEN Position <= 20 THEN "Top 20"
    WHEN Position <= 50 THEN "Top 50"
    WHEN Position <= 100 THEN "Top 100"
END
Click Done.
From here, the report should be fully updated with your data.
That’s it! I hope this BigQuery hack helps you track total rankings in a way that is more visually interesting and scalable.
More Resources:
- Why Keyword Research Is Useful for SEO & How to Rank
- 6 Unique & Free Keyword Research Tools You Didn’t Know You Needed
- A Guide to Essential SEO Tools for Agencies
Image Credits
All screenshots taken by author, April 2021
