This study reported that:

- The optimal combination of 16 evidence-based interventions to reduce new HIV cases differs among six U.S. cities.
- Scaling up city-specific optimal interventions to reach 90 percent of the population would reduce new HIV cases by an average of 5 percent.
- Annual implementation costs to reach national goals would peak by 4 years and then be offset by reduced HIV-related health care costs.
In 2019, the federal government announced a new national Ending the HIV/AIDS Epidemic (EHE) initiative to reduce the number of new HIV cases by 75 percent in 5 years and by 90 percent in 10 years (i.e., by 2030). The continuing HIV epidemic in the United States is currently viewed as a collection of several smaller “microepidemics” localized to specific cities and counties, each with its own set of socioeconomic, racial, and cultural risk factors; health care infrastructures; and policies. Consequently, an intervention—or combination of interventions—that can effectively reduce the number of new HIV cases in one location may not be as successful in another.
In a recent NIDA-supported study, Dr. Bohdan Nosyk from the British Columbia Centre for Excellence in HIV/AIDS and colleagues from many other institutions participating in the Localized HIV Modeling Study Group took a geographically focused economic modeling approach to address this challenge. Their analyses identified optimal intervention combinations for six cities (Atlanta, Baltimore, Los Angeles, Miami, New York City, and Seattle) that are home to nearly one-quarter of all people living with HIV in the United States. They also demonstrated that scaled-up implementation of these interventions can result in substantial cost savings over time. Dr. Nosyk explains, “Our findings have highlighted the need to tailor HIV treatment and prevention strategies to local context in order for the tools we have developed in the fight against HIV/AIDS to provide the most value and greatest public health impact.”
Economic Modeling Identifies Optimal Combination Strategies

For each city, Dr. Nosyk and his team sought to identify an “optimal” combination from among 16 possible interventions for prevention, diagnosis, or treatment of HIV that were selected from the Centers for Disease Control and Prevention’s compendium of evidence-based interventions and from the published literature. The team then fed thousands of demographic, HIV-related, and health care program parameters for each city into their dynamic model and calculated the effects of all possible combinations of the 16 interventions, implemented for 10 years. They found that the optimal set of HIV interventions—the combination that was most effective in reducing HIV cases at the lowest cost—was city specific, reflecting each setting’s unique demographic and health care factors (see Figure 1).
Optimal Implementation Has Public Health and Economic Benefits
Next, the team used their model to predict how many new HIV cases could be prevented in each city if the optimal set of HIV interventions was implemented for 10 years at three different levels of intensity:
- At the existing service levels (i.e., the status quo)
- At a previously attempted scale-up level
- At an ideal scale-up that would reach 90 percent of the population
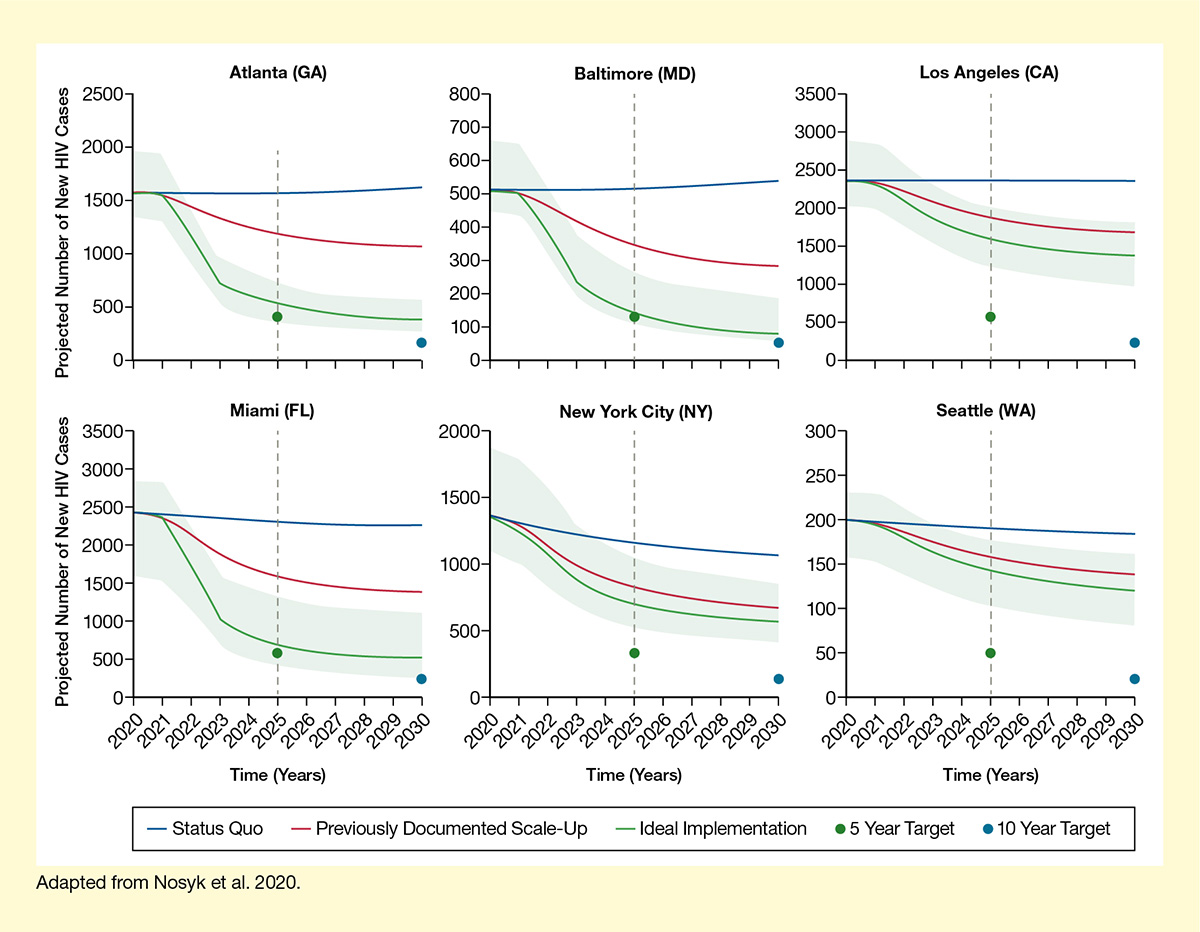
They found that implementing the city-specific sets of interventions for 10 years at a previously attempted higher scale would reduce the number of new HIV cases by 31 percent to 50 percent (see Figure 2). Implementation at the ideal scale for 10 years would reduce the number of new HIV cases by an average of 64 percent across all cities, ranging from 40 percent in Seattle to 84 percent in Baltimore and thus approaching the national goal of a 90-percent reduction at least in some cities. Even greater reductions in HIV incidence would be possible at the ideal implementation scale in Black (average reduction of 79 percent) and Hispanic populations (average reduction by 85 percent).
The team’s analyses also demonstrated that these interventions would have not only public health benefits, but also economic benefits. They calculated that while implementation of the optimal combination of HIV interventions at the ideal scale would cost a total of $3.51 billion over the 10-year period, the annual cost would peak by year 4. After that, the costs would be offset by the cost savings due to reduced new HIV cases. Nevertheless, reaching the national goal by 2030 would require an almost 2-fold increase in the funding currently budgeted to combat the HIV epidemic.
Dr. Nosyk and colleagues noted that their model included only 16 evidence-based HIV interventions and did not consider factors that indirectly affect the number of HIV cases, such as cultural stigma, health literacy, and barriers to health care delivery or access. He says, "While implementing combinations of evidence-based interventions can provide good value, and move jurisdictions closer to national reduction goals, reaching EHE targets will require additional efforts to reduce racial/ethnic inequities in access to care, and employ complementary strategies to overcome other social and structural barriers to HIV care.” Despite these limitations, their model can and will be updated as new data emerge, including new interventions and approaches to improve delivery of and reduce barriers to care. “We are now focusing on determining the potential impact of strategies designed explicitly to reduce or eliminate racial/ethnic disparities,” explains Dr. Nosyk.
- Text Description of Figure 1
-
This figure illustrates that the optimal combination of interventions to prevent HIV differs among six U.S. cities. The three blocks of rows represent four prevention interventions, five diagnosis intervention, and seven treatment interventions. The effects for each of these measures was modeled for each of the six cities (Atlanta, Baltimore, Los Angeles, Miami, New York City, and Seattle), and the effects are indicated by colored rectangles. Green rectangles indicate interventions that should be implemented or scaled up, and yellow rectangles indicate interventions that should not be implemented or scaled up from existing levels.
Among the prevention interventions, syringe service programs should be implemented or scaled up in Atlanta, Los Angeles, and Miami, but not in Baltimore, New York City, or Seattle. Medication treatment for opioid use disorder (MOUD) with buprenorphine as well as with methadone should be implemented or scaled up in all six cities. Targeted pre-exposure prophylaxis for high-risk men who have sex with men should be implemented or scaled up in Atlanta, Baltimore, Miami, New York City, and Seattle, but not in Los Angeles.
Among the diagnosis interventions, opt-out testing in emergency rooms or primary care should not be implemented or increased from the current levels in either of the cities. However, electronic medical records (EMR) testing offer reminders should be implemented or scaled up in all six cities, as should be nurse-initiated rapid testing. MOUD-integrated rapid testing should be implemented in Atlanta, Baltimore, Los Angeles, Miami, and New York City, but not in Seattle.
Among the treatment interventions, case management using the Anti-Retroviral Treatment and Access to Services (ARTAS) program should be implemented or scaled up in all cities. Care coordination should not be implemented or increased in either of the six cities, whereas targeted care coordination should be implemented or scaled up in all cities. EMR antiretroviral therapy (ART) engagement reminders should be implemented or scaled up in Los Angeles, Miami, New York City, and Seattle, but not in Atlanta and Baltimore. ART initiation through the Rapid ART Program for Individuals with HIV Diagnosis should be implemented or scaled up in all six cities. Both enhanced personal contact and relinkage programs should be implemented or scaled up in Baltimore, Los Angeles, Miami, New York City, and Seattle, but not in Atlanta.
- Text Description of Figure 2
-
The six graphs show the effects of implementation of the city-specific optimal combinations of HIV interventions on the number of new HIV cases over 10 years. The horizontal x-axes show the time in years from 2020 to 2030. The vertical y-axes show the projected number of HIV cases per year; scales differ for each city. In each graph, the upper blue line represents the projected number of new cases if the interventions are implemented at the current level (status quo), the middle red line represents the number of cases if the measures are implemented at a previously documented scale-up, and the bottom green line represents the projected number of cases if the measures are implemented or scaled up at an ideal rate. Green dots on the vertical dashed line represent the 5-year target of a 75-percent reduction in HIV incidence for each city in 2025, and blue dots at the far right indicated the 10-year target of a 90-percent reduction in HIV incidence for each city in 2030. The light green bands surrounding the ideal implementation curve represent the 95-percent credible interval for the optimal combination.
For Atlanta (top right panel), the incidence in 2020 was about 1,600 cases. If the status quo was maintained, the number of new cases would increase slightly to about 1,700 cases by 2030. Implementation of the optimal combination of interventions at a previously documented scale up would reduce the number of new cases to about 1,200 by 2030, and implementation at the ideal scale-up would reduce the number of new cases to about 400 by 2030, approaching the 5-year (400 cases) and 10-year (100 cases) targets.
For Baltimore (top middle panel), the incidence in 2020 was about 510 cases. If the status quo was maintained, the number of new cases would increase slightly to about 550 cases by 2030. Implementation of the optimal combination of interventions at a previously documented scale up would reduce the number of new cases to about 290 by 2030, and implementation at the ideal scale-up would reduce the number of new cases to about 9 by 2030, approaching the 5-year (130 cases) and 10-year (60 cases) targets.
For Los Angeles (top right panel), the incidence in 2020 was about 2,400 cases. If the status quo was maintained, the number of new cases would remain stable until 2030. Implementation of the optimal combination of interventions at a previously documented scale up would reduce the number of new cases to about 1,700 by 2030, and implementation at the ideal scale-up would reduce the number of new cases to about 1,400 by 2030; substantially higher than the 5-year (600 cases) and 10-year (240 cases) targets.
For Miami (bottom left panel), the incidence in 2020 was about 2,500 cases. If the status quo was maintained, the number of new cases would decrease slightly to about 2,300 cases by 2030. Implementation of the optimal combination of interventions at a previously documented scale up would reduce the number of new cases to about 1,400 by 2030, and implementation at the ideal scale-up would reduce the number of new cases to about 500 by 2030, meeting the 5-year target (600 cases) and approaching the 10-year target (250 cases).
For New York City (bottom middle panel), the incidence in 2020 was about 1,400 cases. If the status quo was maintained, the number of new cases would decline to about 1,100 cases by 2030. Implementation of the optimal combination of interventions at a previously documented scale up would reduce the number of new cases to about 700 by 2030, and implementation at the ideal scale-up would reduce the number of new cases to about 600 by 2030, substantially above the 5-year (350 cases) and 10-year (140 cases) targets.
For Seattle (bottom right panel), the incidence in 2020 was about 200 cases. If the status quo was maintained, the number of new cases would remain stable until 2030. Implementation of the optimal combination of interventions at a previously documented scale up would reduce the number of new cases to about 140 by 2030, and implementation at the ideal scale-up would reduce the number of new cases to about 120 by 2030, substantially above the 5-year (50 cases) and 10-year (20 cases) targets.
Source:
- Nosyk B, Zang X, Krebs E, et al. Ending the HIV epidemic in the USA: an economic modelling study in six cities. Lancet HIV. 2020;7(7):e491-e503. doi:10.1016/S2352-3018(20)30033-3