
![]()
ECG Case 121
You receive a pre-hospital notification regarding a 74-year-old man presenting with one hour of central chest pain.
His vital signs on arrival: HR 58, BP 133/75, SpO2 99% RA. He has no past medical history or cardiovascular risk factors.
Describe and interpret this ECG
ECG ANSWER and INTERPRETATION
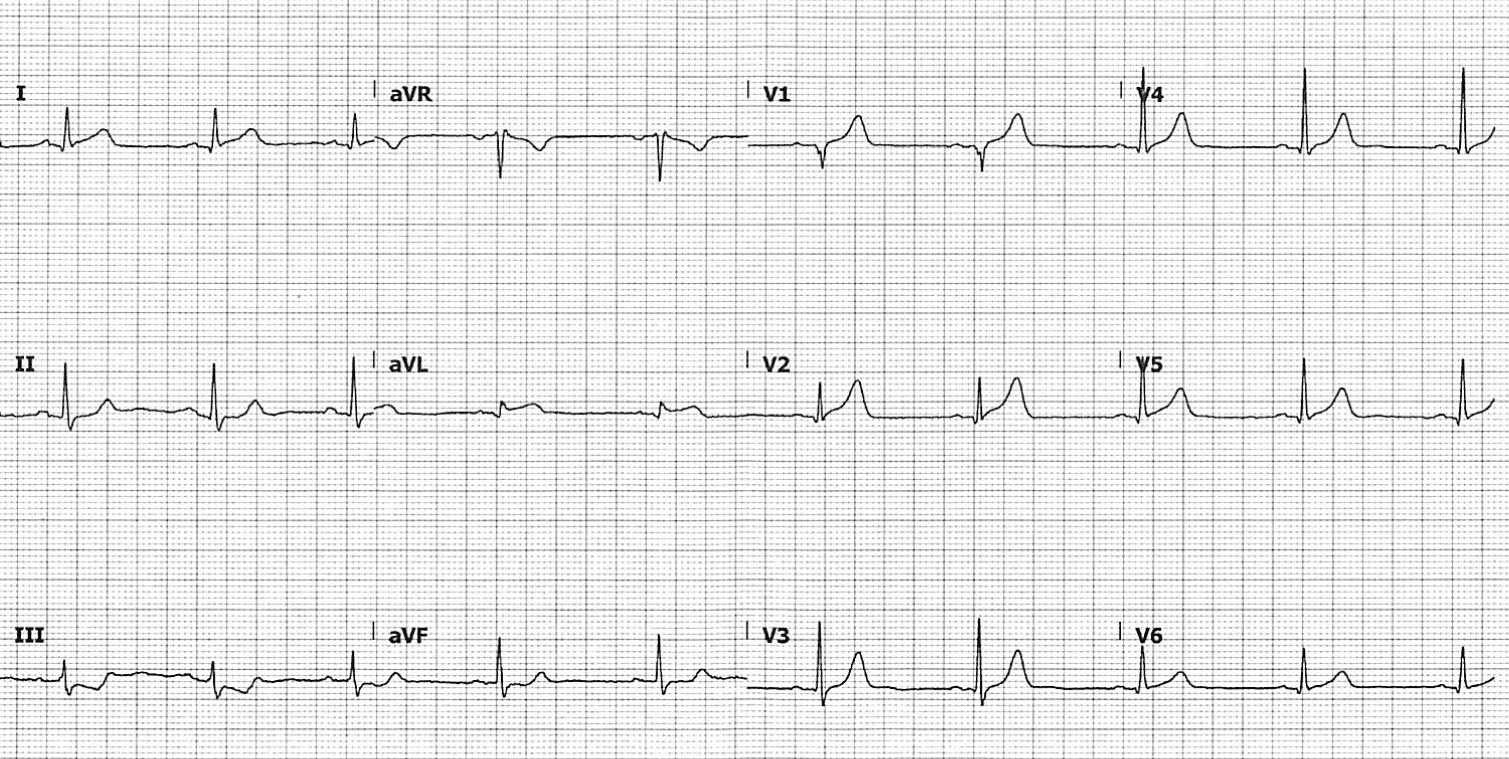
- Normal sinus rhythm
- ST elevation in lead I, aVL and V1-2
- ST depression and T-wave inversion in lead III
- Hyperacute T-waves and pathological Q waves in V1-2
- Trace ST elevation in V5-6
What is the diagnosis?
Reveal answer
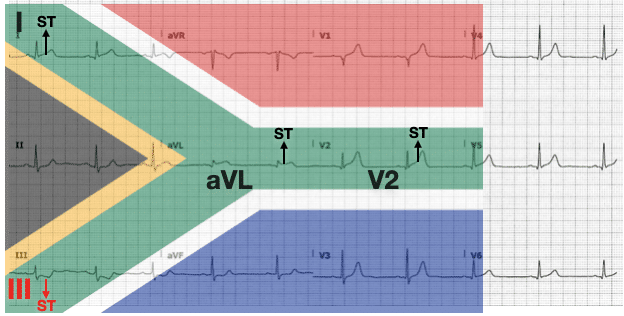
This ECG pattern, also known as the South Africa Flag Sign, is typically seen in “high lateral” Occlusion Myocardial Infarction, usually due to complete occlusion of the first diagonal branch of the LAD. Trace ST elevation seen here in leads V5-6 may be due to lateral wall involvement or early repolarisation.

Left circumflex artery occlusion can also cause this ECG pattern, but usually causes more pronounced ST elevation in leads V5-6.

NB: Although the “high lateral” term is so commonly used, there is no true high lateral wall in the left ventricle, and the term mid-anterior or basal MI is more anatomically correct as these are the corresponding segments.
OUTCOME
This patient underwent emergent angiography demonstrating a 100% occlusion of the first diagonal branch of the LAD, as well as severe triple vessel disease. Successful PCI was performed to his LAD-D1 with resultant TIMI-3 flow.
CLINICAL PEARLS
The South Africa Flag Sign should be in every critical care practitioner’s knowledge base as a “STEMI-equivalent”, regardless of the magnitude of ST-segment changes seen. The apparent non-contiguous nature of ST elevation means this pattern can be overlooked even by experienced Emergency Physicians.
Lead III: the most accurate reflector of high lateral OMI
There is no lead that directly reflects the “high lateral region” usually supplied by the LAD-D1 vessel. Infarction of this territory therefore often causes subtle ST segment changes that fail to meet STEMI criteria. Lead III is directly reciprocal to this region, and thus ST depression and T-wave inversion in lead III is often more pronounced than any ST elevation seen elsewhere.
ST depression does not localise
The reciprocal ST depression seen in leads III and aVF is often mistaken for inferior ischaemia. One must recall that ST depression does not localise, and such localised ST depression here should be assumed to be a reflection of ST elevation in mirror image leads.
- The South Africa Flag Sign is an important STEMI (-) OMI (+) pattern that should be in every critical care practitioner’s knowledge base
- Lead III is directly reciprocal to the high lateral region and thus may manifest the most pronounced ECG changes seen in high lateral OMI
- ST depression does not localise on the ECG — localised ST depression in any lead should be assumed to be a reflection of infarction in mirror image leads
FURTHER READING
LITFL Related topics
Expert Review
- Smith SW. The resident made the diagnosis immediately. The faculty was not as certain. Dr Smith’s ECG Blog
- Bayés de Luna et al. A New Terminology for Left Ventricular Walls and Location of Myocardial Infarcts That Present Q Wave Based on the Standard of Cardiac Magnetic Resonance Imaging. Circulation. 2006;114:1755–1760
TOP 150 ECG Series

MBBS (UWA) CCPU (RCE, Biliary, DVT, E-FAST, AAA) Adult/Paediatric Emergency Medicine Advanced Trainee in Melbourne, Australia. Special interests in diagnostic and procedural ultrasound, medical education, and ECG interpretation. Editor-in-chief of the LITFL ECG Library. Twitter: @rob_buttner
Interventional cardiologist, ECG and hemodynamics fan. MD, Assoc. Prof. at Marmara University, Pendik T&R Hospital, Assoc. Editor at Archives of TSC, ESC National Prevention Coordinator