
![]()
ST depression does not localise
I have had a few people ask me about the following statement from ECG Case 121:
“The reciprocal ST depression seen in leads III and aVF (in high lateral infarction) is often mistaken for inferior ischaemia. One must recall that ST depression does not localise, and such ST depression should be assumed to be a reflection of ST elevation in mirror image leads.”
Buttner, Aslanger: ECG Case 121
“ST depression does not localise” – what does this mean?
The term “localise” has two relevant interpretations here.
Firstly, contrary to common belief and computer interpretation, ST depression alone does not accurately represent the location of myocardial ischaemia. Terms such as “inferior ischaemia” based on ST depression in inferior leads are misnomers.
Secondly, subendocardial ischaemia produces a fairly typical pattern of ST depression, most commonly involving leads II and V4-6, with reciprocal ST elevation in aVR. This is regardless of which part of the myocardium is under stress. As such, ST depression localised to other regions such as inferior and/or anterior leads is unusual for “ischaemia” and should raise concern for reciprocal infarction. ST depression due to subendocardial ischaemia typically does not localise to specific myocardial territories on the ECG
So, let’s look more closely at these two aspects.
One cannot localise the specific site of myocardial ischaemia using ST depression alone
In patients undergoing exercise stress testing with known single vessel disease, ST depression seen does not accurately reflect the regions of ischaemia and is often non-specific. For example, patients with right coronary artery (RCA) stenosis do not necessarily manifest inferior lead ST depression.
Unfortunately, the electrophysiology behind this is not fully understood — we know that ST elevation, Q waves, and T wave inversion (TWI) all do accurately reflect the location of ischaemia or infarction. ST depression is thought to represent the boundary between ischaemic and non-ischaemic myocardium, and thus while it may overlap the underlying non-transmural ischaemia, it likely spans a much wider, non-specific area.
Here are four examples:
Fuchs et al. (1982)
Population: 134 patients with angiographically demonstrated one-vessel disease
Findings:
- Q waves, ST elevation, and TWI in leads I, aVL and V1-4 were all highly correlated with presence of LAD stenosis. The same ECG findings in II, III, and aVF were associated with RCA or LCx stenosis
- In contrast, ST depression alone did not reliably predict the site of coronary artery narrowing
- Leads V5, V6 and II had the highest prevalence of positivity in detecting ischaemia during stress testing, regardless of the location of the lesion or region of ischaemic myocardium. 88% of patients had ST depression in these leads
Reference
- Fuchs RM, Achuff SC, Grunwald L, Yin FC, Griffith LS. Electrocardiographic localization of coronary artery narrowings: studies during myocardial ischemia and infarction in patients with one-vessel disease. Circulation. 1982 Dec;66(6):1168-76
Haraphongse et al (1985)
Population: 143 patients with positive stress test and single-vessel disease
Findings:
- The pattern of ST depression on 12-lead ECG was similar in patients with single-vessel LAD, RCA or LCx disease
- The pattern in single-vessel disease was also comparable to two-vessel, three-vessel, or left main stem disease
Reference
- Haraphongse M, Kappagoda T, Rossall RE. Localization of coronary artery disease with exercise induced ST segment depression: coronary angiographic correlation. Can J Cardiol. 1985 Mar;1(2):92-6.
Kurata et al (1992)
Population: 409 patients with positive exercise stress testing undergoing coronary angiography
Findings:
- 150 patients demonstrated one ischaemic region and ST depression as only ECG abnormality
- The frequency of ST depression in each lead was similar between patients with anterior, lateral, or inferior ischaemia, and most commonly involved lead II, V4, V5 and/or V6
- Only 2.6% of patients manifested ST depression in aVL
Reference
- Kurata et al. Localization of Exercise-Induced Myocardial Ischaemia with ST Depression. Internal Medicine 1992; 31(5): 583-588
Kang et al (2000)
Population: 552 patients with reversible perfusion defect in one vascular territory on MPS underwent exercise stress testing
Findings:
- In patients with maximal ST depression in anterior leads, perfusion defect was in LAD in 30%, RCA 52%, LCx 18%
- In patients with maximal ST depression in inferior leads, perfusion defects was in RCA territory in 44%, in the LAD territory in 42%, and in the LCX territory in 14%
Reference
- Kang X, Berman DS, Lewin HC, Miranda R, Agafitei R, Cohen I, Friedman JD, Germano G. Comparative localization of myocardial ischemia by exercise electrocardiography and myocardial perfusion SPECT. J Nucl Cardiol. 2000 Mar-Apr;7(2):140-5.
Where is the disease?
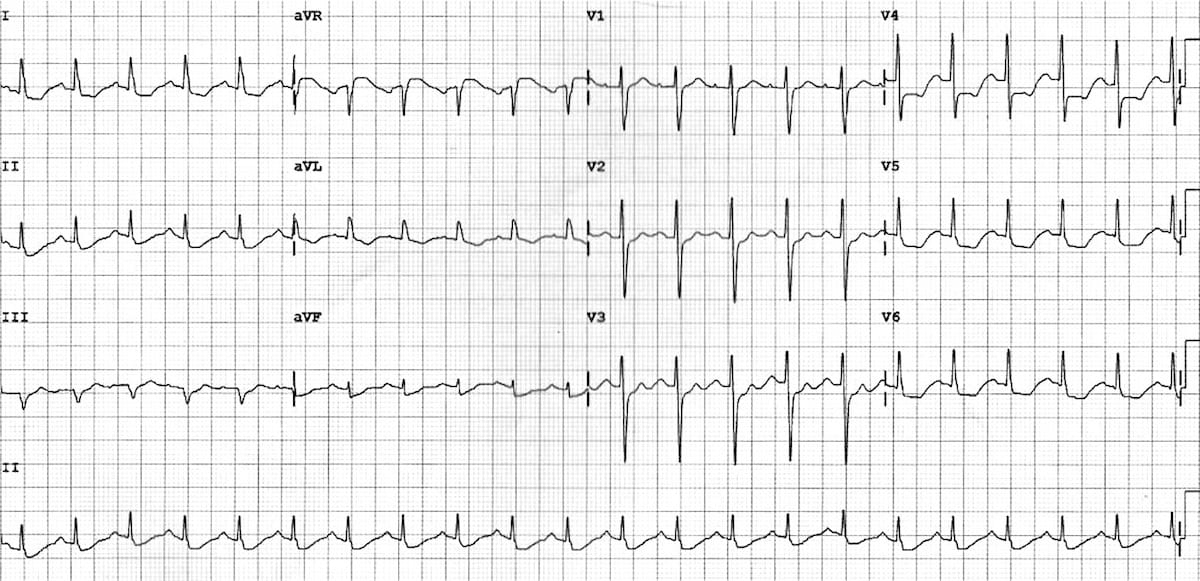
We are all familiar with this pattern of ST elevation in aVR and widespread ST depression. This ECG pattern simply tells us there is an oxygen supply/demand mismatch causing subendocardial ischaemia. In a clinical context, this can be due to:
- Hypotension
- Hypoxia
- Fixed stenosis limiting flow
However, the ECG here cannot localise such ischaemia and it is not necessarily global. It is likely that patients with this pattern in hypotension and/or hypoxia are essentially giving themselves a stress test, and may have single vessel, two vessel or triple vessel disease manifesting ischaemic changes.
The same pattern can be seen in patients with single vessel disease undergoing exercise stress testing, even in those with isolated inferior ischaemia on myocardial perfusion scan (MPS) due to RCA stenosis. Of course, in the absence of physiological stress, collateral supply means these patients would be unlikely to manifest ECG changes clinically. Such a pattern in suspected acute coronary syndrome (ACS) is therefore often due to LMCA critical stenosis or triple vessel disease.
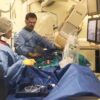
Emergency Physician Dr Sam Ghali provides a great video example of this ECG pattern occurring in a patient with an unstable GI bleed and the importance of recognising this as oxygen supply/demand mismatch.
Note: ST elevation in aVR seen in subendocardial ischaemia is simply a reciprocal change to ST depression usually present in V4-6, I and II. Remember, aVR is a not real lead, it is calculated from leads I and II. Therefore, if there is ST depression in lead I and II, ST elevation in aVR is a corollary, not a magic sign.
ST depression due to subendocardial ischaemia does not typically localise to specific myocardial territories on the ECG, particularly anterior or inferior regions
As we have seen above, oxygen supply/demand mismatch produces a consistent ECG pattern with an ST vector pointing towards aVR, as a result of ST depression in leads V4-6 and II. As such, localised ST depression not involving these leads should be a major red flag for reciprocal occlusion myocardial infarction (OMI).
Example 1: “Anterior ischaemia”
55 year-old man presents with central chest pain
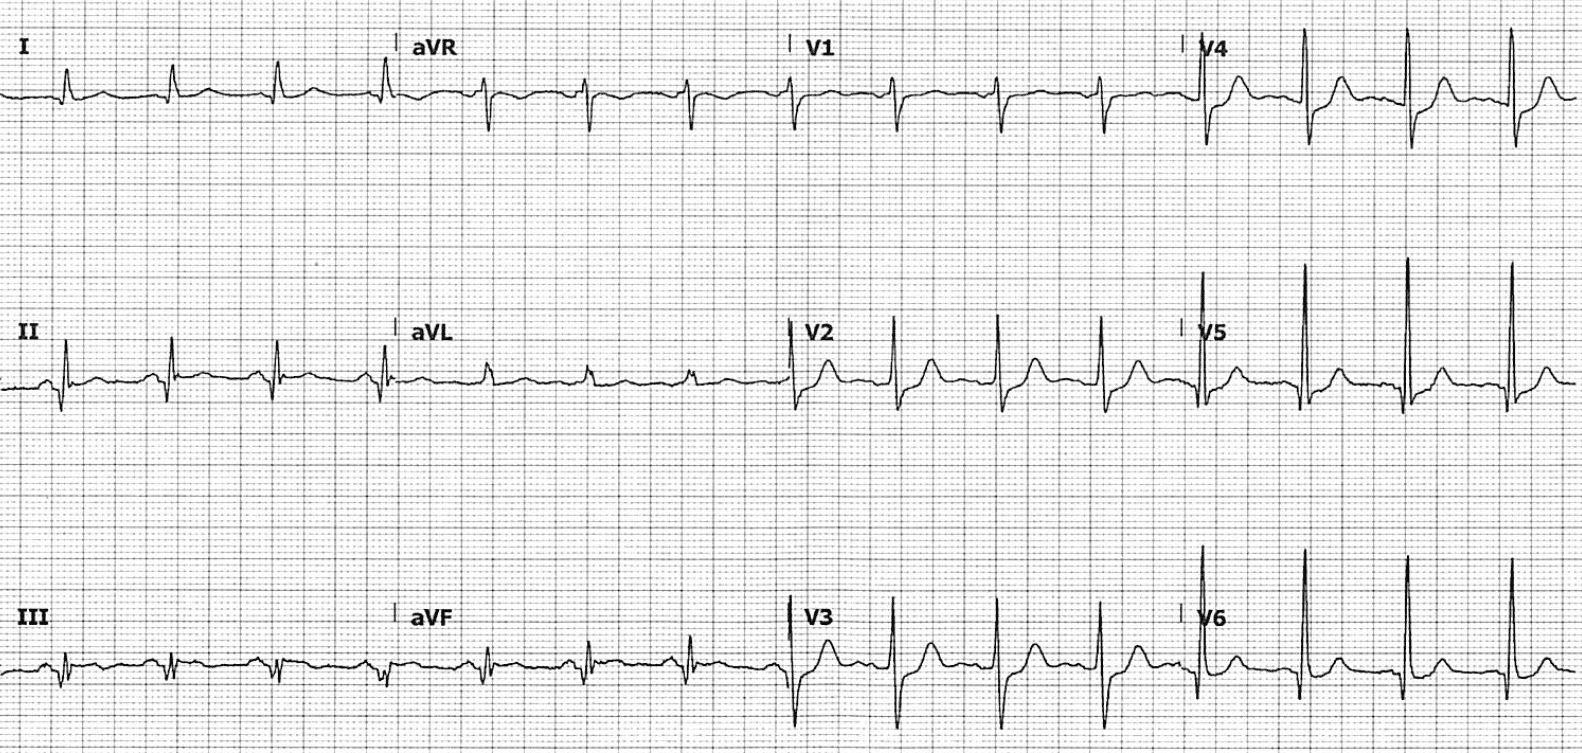
This ECG was signed off as “ST depression in V2-4, anterior ischaemia, repeat in 15 minutes”. The machine interpretation agreed, stating >> ST depression anteriorly, consider ischaemia <<. Posterior leads V7-9 were normal with no ST elevation seen.
We know from above that this interpretation is incorrect for for two reasons. Firstly, we cannot localise myocardial ischaemia based on ST depression alone. Secondly, the absence of ST depression in leads II and V5-6 (and associated ST elevation in aVR) here should raise flags for reciprocal infarction.
Indeed, if we look closely, we note:
- Pathological Q waves and trace ST elevation in inferior leads II, III, aVF
- Trace ST depression in aVL
This ECG is diagnostic for acute inferoposterior occlusion myocardial infarction (OMI). The patient went on to have delayed angiography revealing a complete left circumflex artery occlusion.
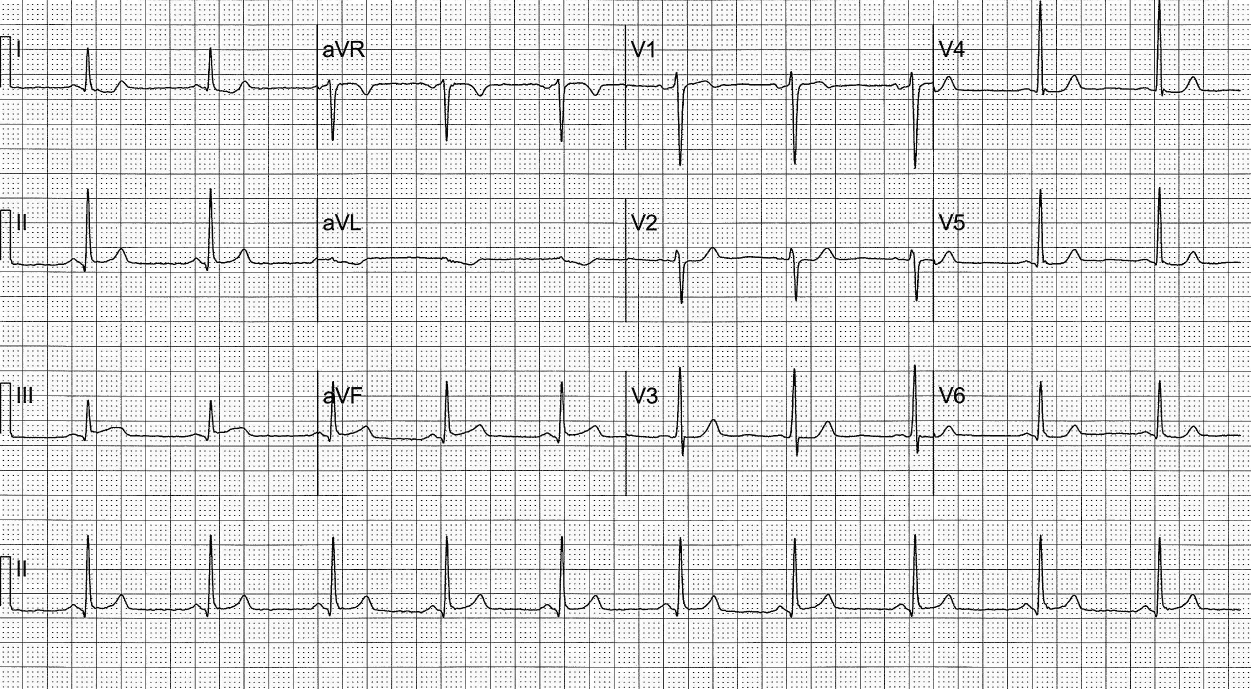
Example 2: “Inferior ischaemia”
74 year-old man presents with central chest pain
ST depression in leads III and aVF here is often misinterpreted as “inferior ischaemia”. Once again, this does not fit with the ECG pattern produced by subendocardial ischaemia, and such localised ST depression should be assumed to be a reflection of ST elevation in mirror image leads. ST elevation in I, aVL and V2 here is diagnostic for high lateral OMI.
This patient had a 100% occlusion of the first diagonal branch of the LAD, as well as severe triple vessel disease. This ECG was featured in ECG Case 121.
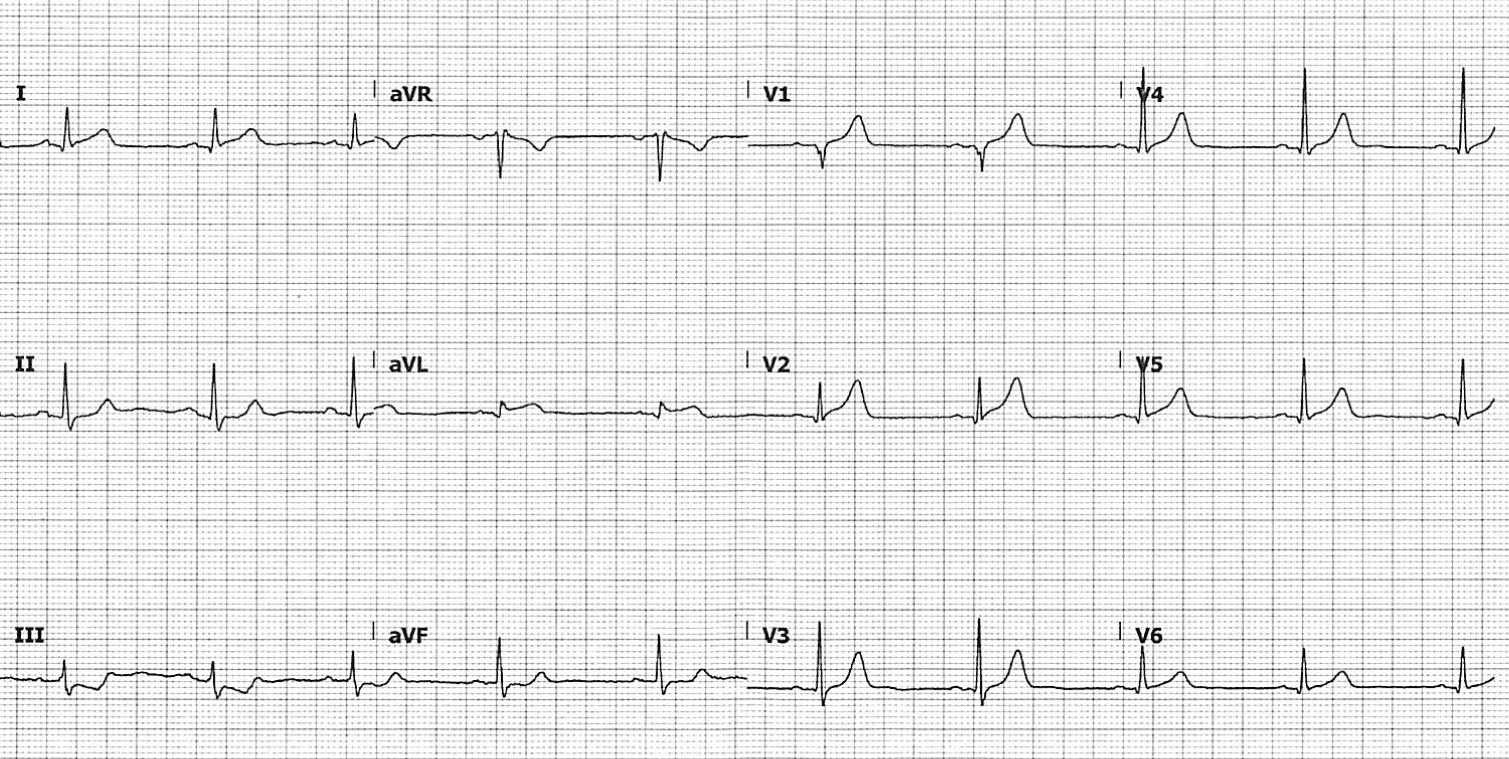
Example 3: aVL, the neglected lead
52 year-old man presents with chest pain
aVR has traditionally been considered the “neglected lead” in the diagnosis of LMCA or triple vessel disease, which we now know simply reflects oxygen supply/demand mismatch.
aVL is likely the neglected lead in the diagnosis of occlusion. ST depression in aVL in the setting of subendocardial ischaemia is rare (2-5% of cases), and when present is usually associated with changes in V4-6 and II. Isolated ST depression in aVL should raise concern for reciprocal changes and inferior OMI. The above patient had a 95% sub-total occlusion of his RCA.
ST depression in aVL as a predictor of inferior OMI
- aVL is the only lead truly reciprocal to the inferior wall, as it is the only lead facing the superior part of the left ventricle
- The significance of aVL changes in inferior OMI can be found mentioned as early as 1993 in the European Heart Journal, where a retrospective review found that ST depression in aVL was more prevalent than STE in inferior leads in a cohort of patients with inferior OMI. In 7.5% of patients with acute inferior OMI, ST depression in aVL was the only ECG sign of infarction
- A 2016 retrospective study compared patients presenting with inferior STE that received final diagnoses of either inferior STEMI or pericarditis. Co-existing presence of ST depression in aVL was found to be highly sensitive for inferior STEMI (confidence interval 98-100%)
- A third population group in the same 2016 paper was reviewed, consisting of “subtle” STEMIs that showed occlusion on PCI but did not meet STEMI criteria. Of these, 91% demonstrated some degree of ST depression in aVL
What about when we have occlusion in the setting of subendocardial ischaemia?
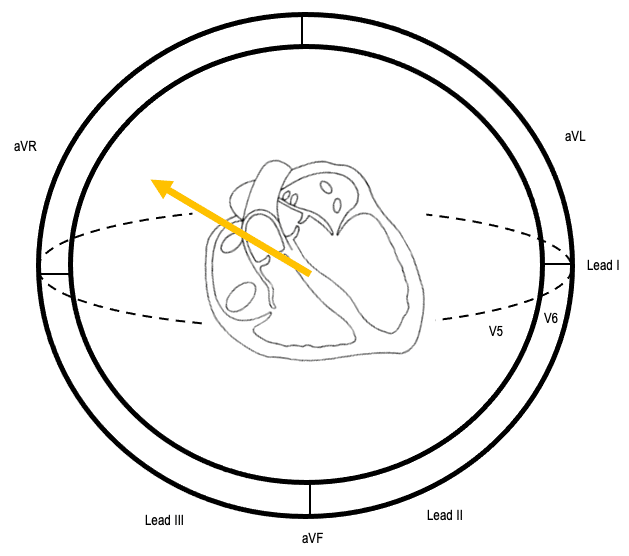
There will be two ST vectors present:
- ST elevation relating to subendocardial ischaemia, directed towards aVR
- ST elevation due to occlusion, directed towards the infarcted territory
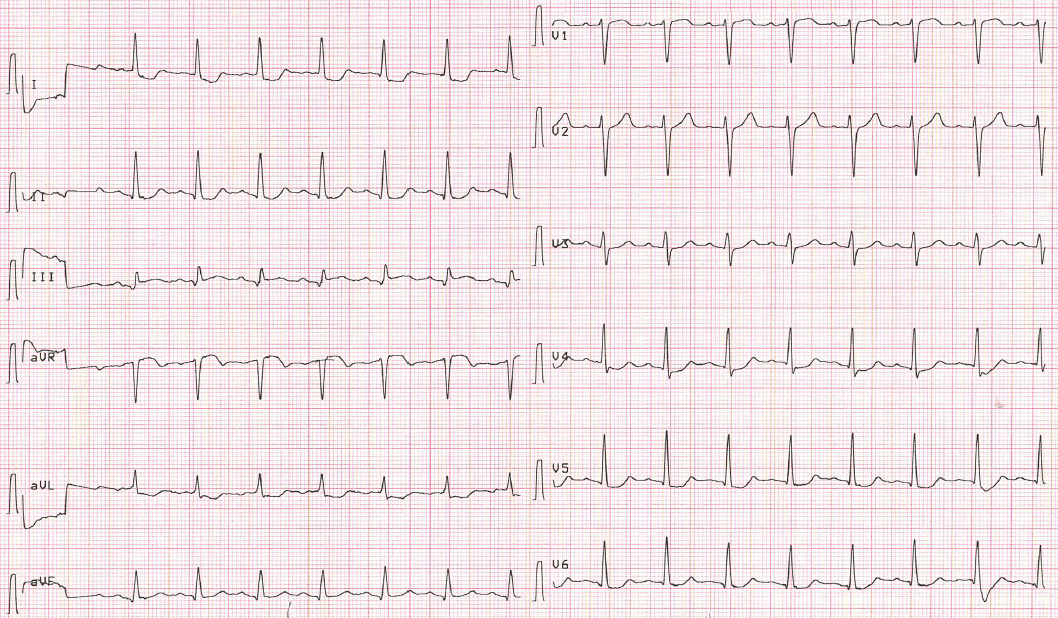
The above ECG, known as Aslanger pattern, is representative of acute inferior OMI in the setting of concomitant multi-vessel disease:
- The ST vector of subendocardial ischaemia directs towards aVR, reflecting ST depression in V4-6 and II
- The ST vector of inferior infarction directs towards II, III and aVF
- The resultant average ST vector directs rightwards, producing ST elevation in lead III and aVR only
Summary
Localised ST depression may be the first indicator of subtle occlusion
ST depression localised to a specific myocardial territory on the ECG is a frequent yet overlooked sign of occlusion myocardial infarction. Often misinterpreted as “localised ischaemia”, these changes should raise suspicion for subtle reciprocal ST elevation and associated infarction. Localised ST depression in anterior precordial leads is recognised as a sign of posterior infarction, but the same awareness is not as prevalent for these changes elsewhere.
ST elevation in aVR? Clinical context is everything
As Dr Stephen Smith outlines in this great case example, the pattern of diffuse ST depression (involving V4-6 and II) and ST elevation in aVR simply represents oxygen supply/demand mismatch, and does not necessarily indicate severe coronary artery disease. The same pattern can be seen in hypotension secondary to other causes, including post-resuscitation following cardiac arrest. We must be cautious to not allow this to distract from attending to other underlying pathology.
A 2019 single-centre retrospective analysis found that in patients undergoing code STEMI activations with this ECG pattern, only 59% had severe coronary artery disease, and none had LMCA or LAD occlusions. 36% of these patients had presented in cardiac arrest. In suspected ACS, ST elevation in aVR and diffuse ST depression warrants early discussion with cardiology and prompt (within 24-48 hours) angiography, but in the absence of ST elevation in V1-2 or elsewhere, is usually not indicative of occlusion.
- We cannot localise the site of myocardial ischaemia using ST depression alone on the ECG
- The pattern of diffuse ST depression involving V4-6 and II, and reciprocal ST elevation in aVR, simply represents oxygen supply/demand mismatch and is not specific for coronary artery disease
- In patients with subendocardial ischaemia, localised ST depression not involving V4-6 and II is rare, and should be a major red flag for reciprocal infarction
Related topics
Expert review
- Smith SW. Subendocardial ischaemia does not localize. Dr Smith’s ECG Blog. 2010 August
- Smith SW. Diffuse subendocardial ischaemia on the ECG. Dr Smith’s ECG Blog. 2016 November
References
- Fuchs RM, Achuff SC, Grunwald L, Yin FC, Griffith LS. Electrocardiographic localization of coronary artery narrowings: studies during myocardial ischemia and infarction in patients with one-vessel disease. Circulation. 1982 Dec;66(6):1168-76
- Haraphongse M, Kappagoda T, Rossall RE. Localization of coronary artery disease with exercise induced ST segment depression: coronary angiographic correlation. Can J Cardiol. 1985 Mar;1(2):92-6.
- Kurata et al. Localization of Exercise-Induced Myocardial Ischaemia with ST Depression. Internal Medicine 1992; 31(5): 583-588
- Birnbaum et al. ST segment depression in a VL: a sensitive marker for acute inferior myocardial infarction. Eur Heart J. 1993 Jan;14(1):4-7
- Kang X, Berman DS, Lewin HC, Miranda R, Agafitei R, Cohen I, Friedman JD, Germano G. Comparative localization of myocardial ischemia by exercise electrocardiography and myocardial perfusion SPECT. J Nucl Cardiol. 2000 Mar-Apr;7(2):140-5.
- Landesberg et al. Perioperative Myocardial Ischemia and Infarction: Identification by Continuous 12-lead Electrocardiogram with Online ST-segment Monitoring. Anesthesiology February 2002, Vol 96, 264-270
- Bischof et al. ST depression in lead aVL differentiates inferior ST-elevation myocardial infarction from pericarditis. Am J Emerg Med. 2016 Feb;34(2):149-54
- Aras et al. Spatial Organization of Acute Myocardial Ischaemia. J Electrocardiol. 2016 May-Jun; 49(3): 323-326
- Harhash et al. aVR ST Segment Elevation: Acute STEMI or Not? Incidence of an Acute Coronary Occlusion. Am J Med. 2019 May;132(5):622-630
- Kharel et al. Implications of Localized ST Depression in a Vascular Territory and Altered Precordial T-Wave Balance in Ischemic Heart Disease. Cureus. 2020 Jun; 12(6): e8580
[cite]
ECG LIBRARY

MBBS (UWA) CCPU (RCE, Biliary, DVT, E-FAST, AAA) Adult/Paediatric Emergency Medicine Advanced Trainee in Melbourne, Australia. Special interests in diagnostic and procedural ultrasound, medical education, and ECG interpretation. Editor-in-chief of the LITFL ECG Library. Twitter: @rob_buttner
Interventional cardiologist, ECG and hemodynamics fan. MD, Assoc. Prof. at Marmara University, Pendik T&R Hospital, Assoc. Editor at Archives of TSC, ESC National Prevention Coordinator