
![]()
ECG Case 125
A 48-year-old woman is brought to triage by her daughter. She has been nauseous for the past few hours and in the past 60 minutes has developed crushing central chest pressure.
Past history includes hypertension and reflux. HR 66, BP 177/62, SpO2 99% RA.
Describe and interpret this ECG
ECG ANSWER and INTERPRETATION
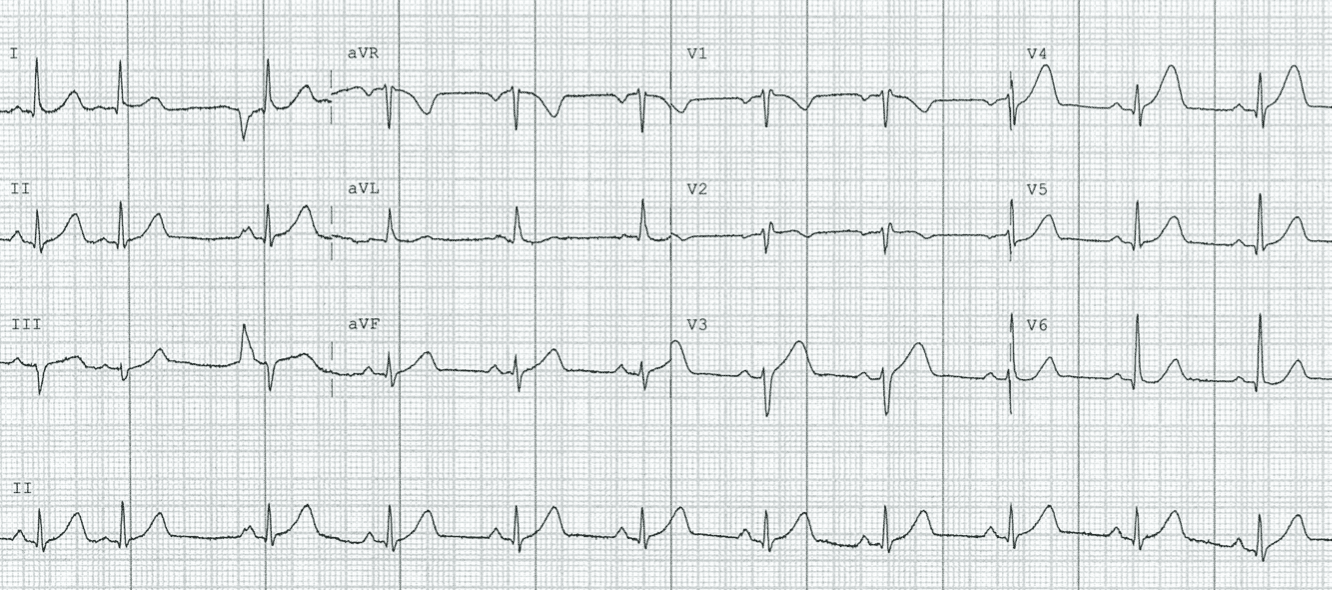
- Normal sinus rhythm, rate 66
- Normal axis
- Borderline intraventricular conduction delay, QRS ~100ms
- ST elevation in V3-4, with associated hyperacute T waves (HATW) that are broad and peaked in nature
- Inferior HATW best visualised in lead II (remember, it is the ratio of T wave amplitude to the preceding complex that is more significant than the overall T wave size). There is straightening of the ST segment in lead III, leading to widened T waves with an increased AUC
In the context of such a concerning history, these changes are highly suggestive of occlusion myocardial infarction secondary to a lesion of the left anterior descending artery (LAD). Here, an ST vector directed anterior and inferiorly is consistent with apical ischaemia, which generally occurs in the early phase of anterior MI, especially when the LAD is occluded after S1 but before D1.
Although not performed here, these authors would use bedside echo to look for associated anterior regional wall motion abnormalities to further confirm the diagnosis and guide cath lab activation.
In this case, serial ECGs were performed to look for dynamics changes:
t + 15 minutes
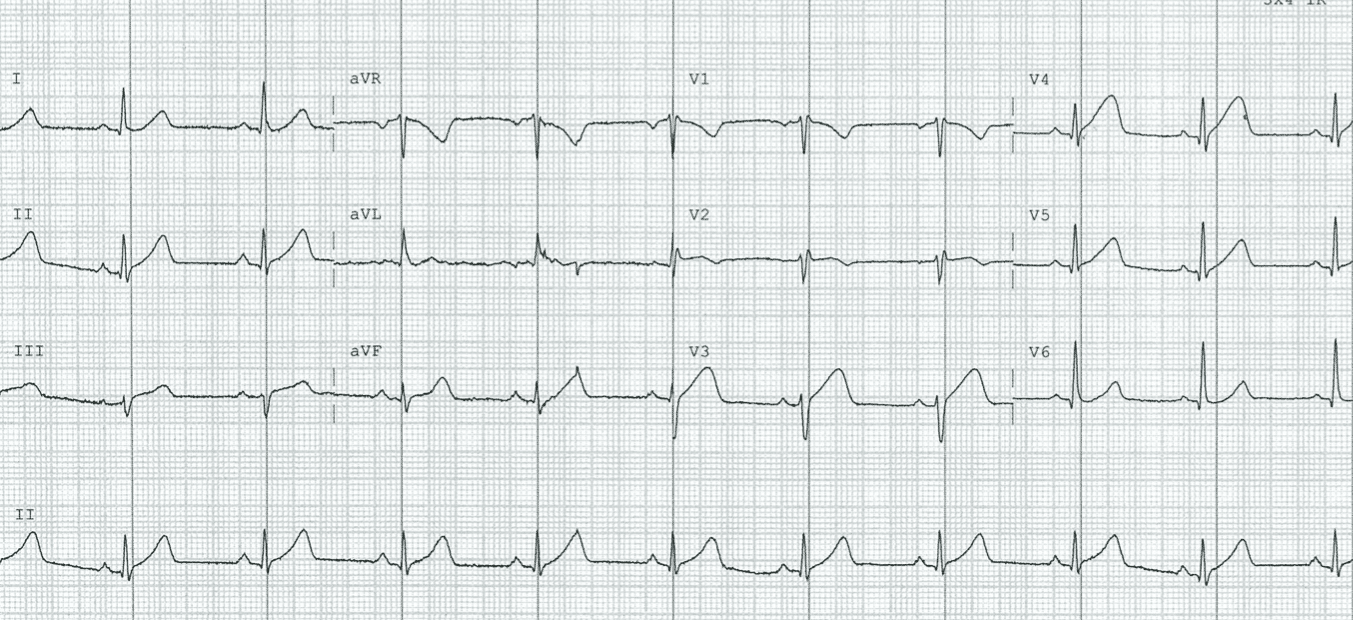
- There is evolution of T wave changes, now more prominent in V4-5 with associated widening
t + 30 minutes
- ST elevation in V3-5 has markedly progressed, now meeting “STEMI criteria”
- There is also evolving ST elevation inferiorly, with straightening of the ST segment in aVF causing a “bulky” appearance to T waves (see discussion)
- At this stage the cath lab was activated
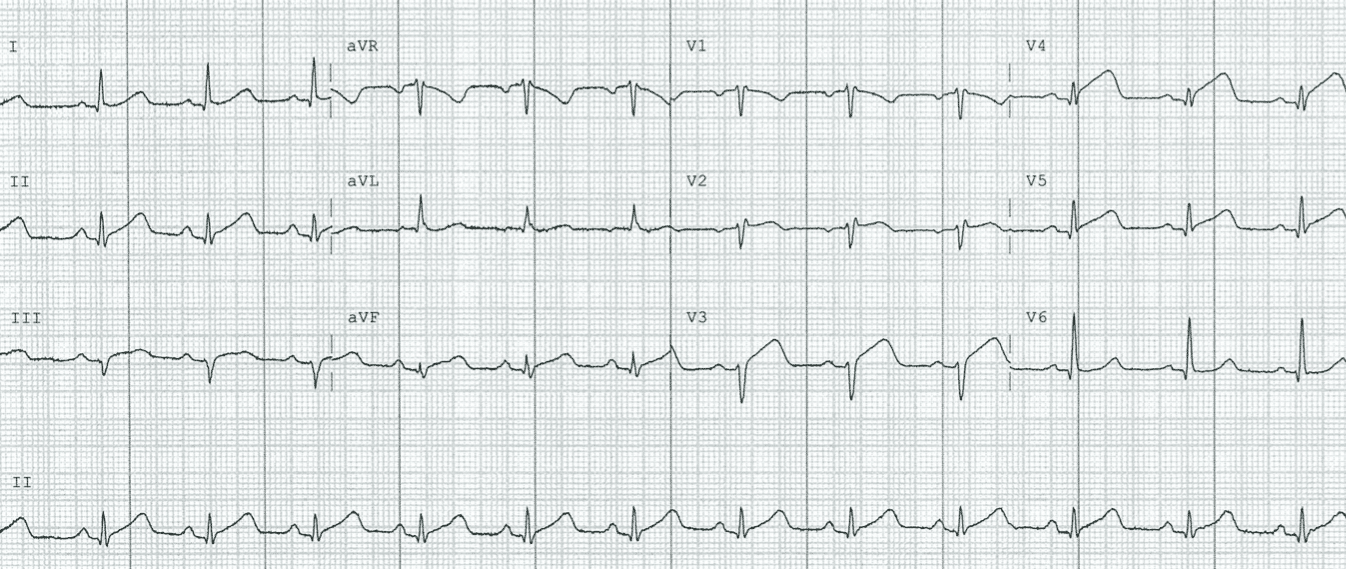
t + 45 minutes

OUTCOME
Following the last ECG, the patient underwent emergent angiography demonstrating a 100% proximal LAD occlusion with subsequent PCI.
The ECG below was taken on discharge one week later:
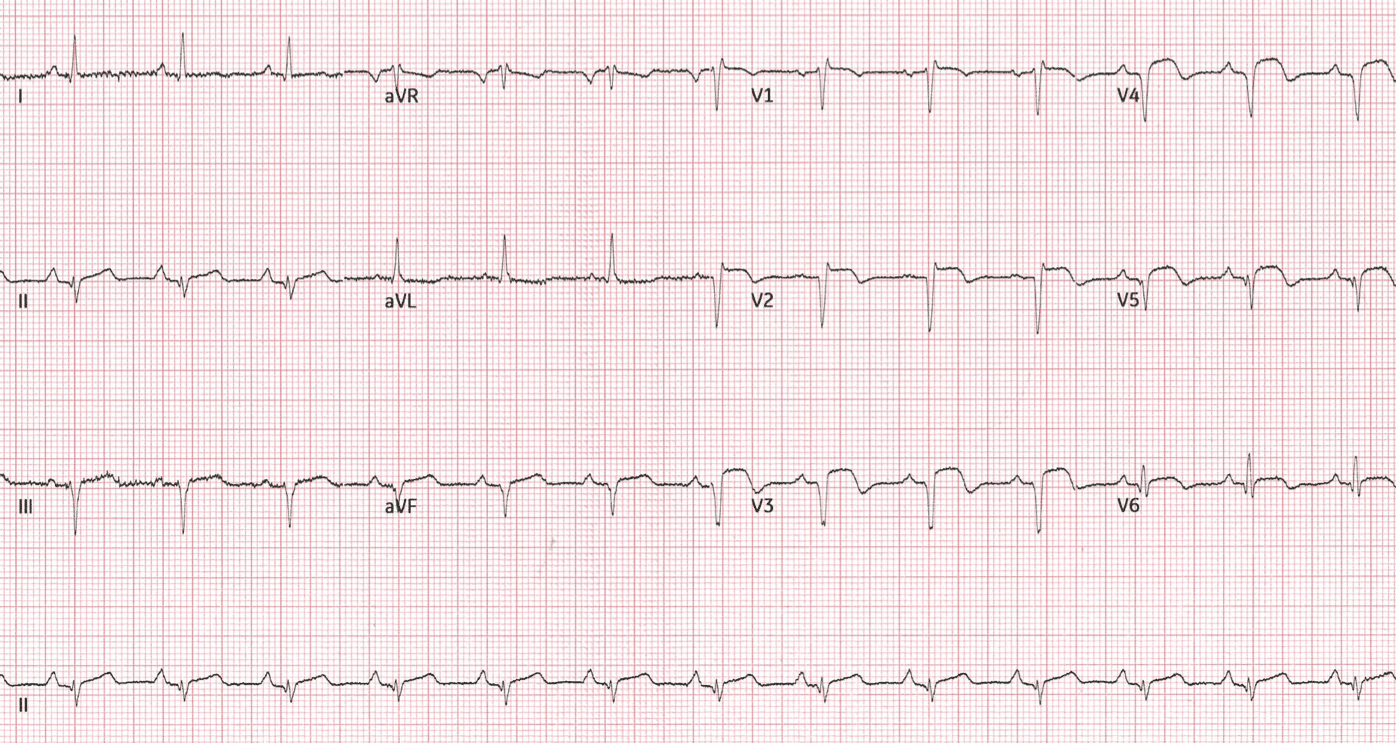
What is your interpretation?
There are changes typical of evolved myocardial infarction:
- Poor R wave progression throughout the precordial leads
- Q wave formation in inferior and precordial leads
- ST elevation in V2-5 with a T wave:QRS ratio < 0.36, typical of left ventricular aneurysm morphology
Although termed “aneurysm” morphology, this persisting ST elevation is more frequently associated with dyskinesia.
CLINICAL PEARLS
Absence of reciprocal changes does not mean absence of occlusion
In proximal occlusions such as this case, myocardial infarct territory can be so extensive that no reciprocal ST depression is seen. The absence of such reciprocal changes, and the presence of “widespread” ST elevation, can mask the diagnosis and lead to the ECG being mislabelled as benign early repolarisation (BER).
“Small” HATW: Proportion and area matters more than height
Despite long-standing recognition that hyperacute T waves (HATW) are usually the earliest ECG manifestation of occlusion myocardial infarction (OMI), there is still no formal, universal definition of what represents a HATW.
It is however recognised that the ratio of T wave amplitude to the preceding complex is of more significance than overall T wave size. As is the case in bundle branch block with “appropriate discordance”, abnormal depolarisation should be followed by abnormal repolarisation. This extends to the context of a low amplitude QRS complex, which should be followed by a relatively low voltage T wave. In addition, the area under the curve (AUC) of the T wave appears more relevant than the overall height. HATWs are wider and generally more symmetric than normal T-waves, and with evolving infarction the ST segment straightens and increases the AUC.
In the right clinical scenario, we believe that HATWs alone are enough to guide a decision regarding reperfusion therapy. However, if there is uncertainty, serial ECGs should be performed as these changes generally precede classic STE findings or resolve if there is spontaneous reperfusion.
Note: although HATWs are a frequently observed “first sign” of OMI, these changes often persist during ongoing infarction (as is the case above) and their presence does not necessarily signify recent onset. We may lose a substantial amount of myocardium if we continue to wait for evolving changes that meet “STEMI” criteria.
Subtle anterior STEMI calculator
The 4-variable subtle anterior STEMI calculator can be used to differentiate subtle ST‐segment elevation due to anterior myocardial infarction (usually due to LAD occlusion) from that due to BER. A simplified version of the formula uses the following four variables:
(R-wave amplitude V4 + QRS amplitude V2) – (QT interval mm + STE60 V3)
STE60 V3: ST segment elevation 60ms after J point in V3
- A value under 12 predicts anterior MI with a sensitivity, specificity, and diagnostic accuracy of 86.9%, 92%, and 90% respectively
- In the presenting ECG of our patient, calculation reveals a value of 0.5, suggestive of anterior STE due to occlusion
Derivation: 3-variable formula
Population: 355 consecutive cases of proven LAD occlusion were reviewed, with those meeting “STEMI criteria” excluded. ECGs of 143 remaining cases of “subtle” anterior STEMI were compared to those of 171 emergency department patients with non-cardiac chest pain and early repolarisation.
Findings:
- Compared with early repolarisation, patients with anterior STEMI had greater ST-segment elevation and lower R wave amplitude in V2-4
- QTc was longer in STEMI versus early repolarisation
- An initial 3-variable formula based on these measurements was derived, with a derived cut-off predicting STEMI with a sensitivity, specificity, and diagnostic accuracy of 91%, 88% and 86% respectively
Reference
- Smith et al. Electrocardiographic differentiation of early repolarization from subtle anterior ST-segment elevation myocardial infarction. Ann Emerg Med. 2012 Jul;60(1):45-56
Derivation: 4-variable formula
Population: The same population group used to derive the 3-variable formula above
Findings:
- A fourth variable, QRS voltage in V2, was added to the previously derived formula. Low QRS voltages were predictive of anterior STEMI, identifying an additional 11 cases compared to the 3-variable formula and improving specificity of the derived formula
Reference
- Driver et al. A new 4-variable formula to differentiate normal variant ST segment elevation in V2-V4 (early repolarization) from subtle left anterior descending coronary occlusion – Adding QRS amplitude of V2 improves the model. J Electrocardiol. 2017 Sep;50(5):561-569
External validation: 3-variable and 4-variable formula
Population: 379 consecutive patients with diagnosis of acute anterior STEMI, and 200 consecutive patients with noncardiac chest pain as a control group. 241 patients in the STEMI group meeting criteria were excluded.
Findings:
- 3-variable formula had a sensitivity, specificity, and diagnostic accuracy of 74%, 87%, and 82% respectively
- 4-variable formula had a sensitivity, specificity, and diagnostic accuracy of 83%, 88%, and 86% respectively
- Simplified 4-variable formula had a sensitivity, specificity, and diagnostic accuracy of 87%, 92% and 90% respectively
Reference
- Bozbeyoglu et al. A tale of two formulas: Differentiation of subtle anterior MI from benign ST segment elevation. Ann Noninvasive Electrocardiol. 2018;23:e12568
- Aslanger et al. A Simplified Formula Discriminating Subtle Anterior Wall Myocardial Infarction from Normal Variant ST-Segment Elevation. Am J Cardiol. 2018 Oct 15;122(8):1303-1309
- Occlusion causing a large infarct territory may manifest widespread ST elevation and an apparent lack of reciprocal changes. Be cautious to not mislabel this as benign early repolarisation (BER)
- In the right clinical context, HATW alone may be sufficient to guide a decision regarding reperfusion therapy. Examine size in proportion to the preceding QRS complex, and look for straightening of the ST segment, leading to “bulky” T waves with an increased AUC
- Bedside echo and the subtle anterior STEMI calculator are additional tools that can assist us to differentiate anterior OMI from BER
Further reading
Related topics
- Occlusion myocardial infarction (OMI)
- Anterior myocardial infarction
- Left ventricular aneurysm
- ST depression does not localise
Expert review
- Smith SW. Formulas to differentiate normal STE from subtle LAD occlusion. Dr Smith’s ECG Blog. 2017 November
References
- Smith et al. Electrocardiographic differentiation of early repolarization from subtle anterior ST-segment elevation myocardial infarction. Ann Emerg Med. 2012 Jul;60(1):45-56
- Driver et al. A new 4-variable formula to differentiate normal variant ST segment elevation in V2-V4 (early repolarization) from subtle left anterior descending coronary occlusion – Adding QRS amplitude of V2 improves the model. J Electrocardiol. 2017 Sep;50(5):561-569
- Bozbeyoglu et al. A tale of two formulas: Differentiation of subtle anterior MI from benign ST segment elevation. Ann Noninvasive Electrocardiol. 2018;23:e12568
- Aslanger et al. A Simplified Formula Discriminating Subtle Anterior Wall Myocardial Infarction from Normal Variant ST-Segment Elevation. Am J Cardiol. 2018 Oct 15;122(8):1303-1309
TOP 150 ECG Series

MBBS (UWA) CCPU (RCE, Biliary, DVT, E-FAST, AAA) Adult/Paediatric Emergency Medicine Advanced Trainee in Melbourne, Australia. Special interests in diagnostic and procedural ultrasound, medical education, and ECG interpretation. Editor-in-chief of the LITFL ECG Library. Twitter: @rob_buttner

Interventional cardiologist, ECG and hemodynamics fan. MD, Assoc. Prof. at Marmara University, Pendik T&R Hospital, Assoc. Editor at Archives of TSC, ESC National Prevention Coordinator
I believe there were reciprocal changes right from the first ECG.
The quickest way to ” sniff ” acute MI is to look at Lead III and aVL : if there there is acute MI then you can see the ST segment oppose each other i.e if it up in aVL it should down in Lead III and vice versa.
Now look at Lead III and aVL in the first ECG , you can see a ”tad bit” of STE in Lead III, AND a ”tad bit” of ST depression in aVL.
I have tried this tip and helped me so much in early identification of MI, and needless to say of course that will also look for ALL other leads and the changes in T an ST and the measurements you mentioned, but in my experience , that helped me much : LOOK AT LEAD III AND aVL : THE ST segment SHOULD OPPOSE EACH OTHER IN ACUTE MI…
Regards
Dr Samarrae Z.
Consultant ER
Kingdom of Bahrain