
![]()
ECG Case 127
A 37-year-old man is brought in from a nightclub with reduced level of consciousness following a mixed overdose of cocaine and GHB (gamma hydroxybutyrate).
On arrival his vital signs include: GCS 6; RR 14; SpO2 94% on RA; HR 75bpm regular; BP 88/62.
Your colleague shows you his ECG:
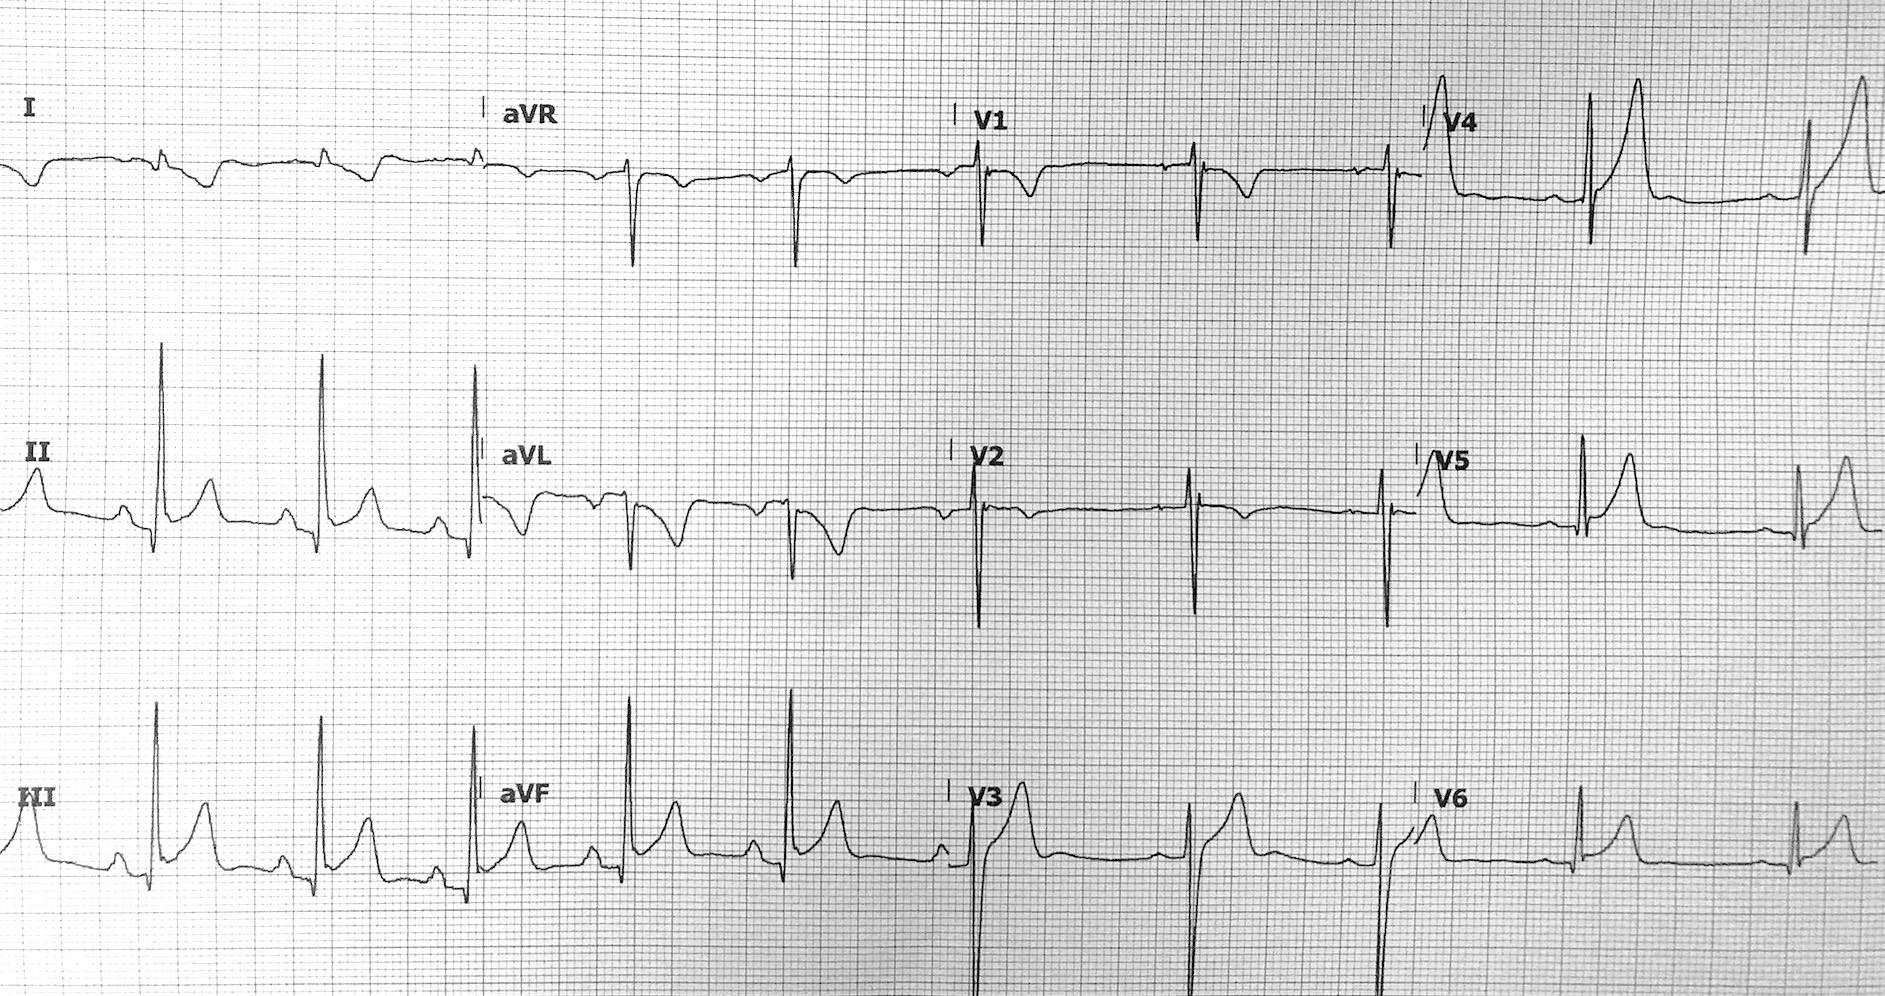
There are inferior Q waves, and reciprocal ST depression and T-wave inversion in aVL. Could this be inferior MI in the context of cocaine use?
Describe and interpret this ECG
ECG ANSWER and INTERPRETATION
- Sinus arrhythmia, rate 60 BPM
- Borderline right axis deviation + 90 degrees
- Q waves in inferior leads – 2mm in depth and narrow
- Concave ST elevation in inferior leads with notching of the J point
- Reciprocal ST depression in aVL with T-wave inversion but a narrow QRS-T wave angle
- Prominent T waves in V4-5 concordant with preceding QRS complex
- Normal QT interval
Is this an inferior myocardial infarction?
Reveal answer
No.
This is vertical orientation of the heart with associated inferior benign early repolarisation (BER). If someone showed me this ECG, the first thing I would ask would be – “Is this a tall, thin male?”
Localisation of STE to inferior leads here is a reflection of cardiac axis, which is approximately +90 degrees (“inferior axis”). ECG changes of BER are simply global repolarisation abnormalities that follow the overall vector of depolarisation. The reason BER is usually seen in precordial leads is because in the majority of patients, the overall vector of depolarisation is directed downwards and leftwards (i.e. towards I, II and V4-6).
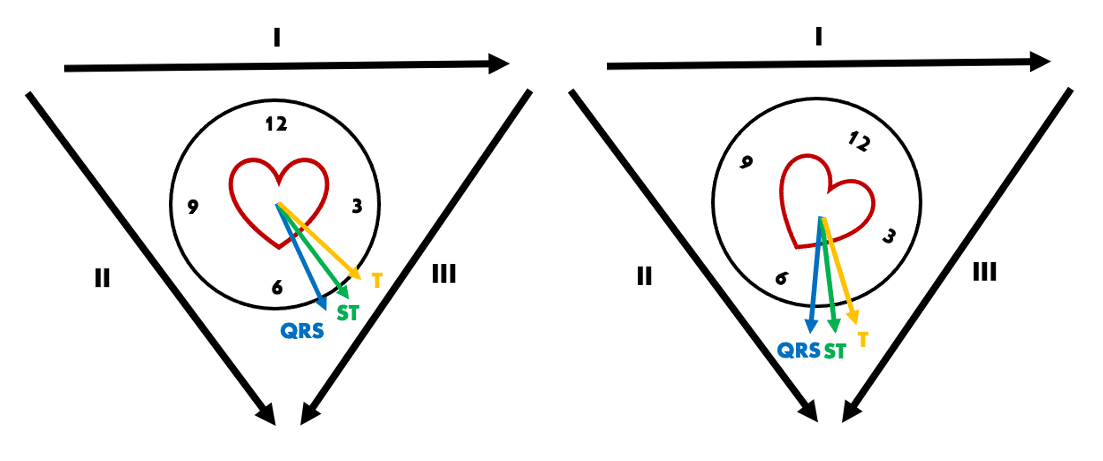
Right: “Vertical” positioning means the overall depolarisation vector is directed inferiorly, producing ECG changes of BER in inferior leads
Reciprocal ST depression is related to the orientation of the ST vector, not the pathology itself. Inferior MI causes reciprocal STD because the STE vector points rightwards and downwards, which causes STD in I and aVL. However, anything that causes an STE vector pointing in this direction, such as BER in a vertically orientated heart, will cause the same “reciprocal” STD. In the more common precordial variant of BER, we see such reciprocal change in aVR.
T wave inversion in aVL here is normal, as there is a relatively narrow QRS-T wave angle (discussion below).
OUTCOME
This patient was monitored in a resuscitation bay with gradual return of conscious state. Serial troponins were below the detectable range and he was discharged without complication.
CLINICAL PEARLS
What is the QRS-T wave angle?
Although the term cardiac axis is accepted to reflect QRS axis corresponding to ventricular depolarisation, we can also measure separate P and T wave axes. Specifically, the T wave axis corresponds to the axis of ventricular repolarisation. The angle difference between these two axes is referred to as the QRS-T wave angle. This angle is usually narrow in secondary repolarisation abnormalities such as BER (less than 45 degrees), and widens in ischaemia or infarction.
QRS-T wave angle can help differentiate primary and secondary repolarisation abnormalities
Contrary to common belief, T wave inversion in aVL can be a normal finding. The QRS-T wave angle can assist in differentiating this.
ST segment and T wave changes represent ventricular repolarisation abnormalities. However, as we know, there are “normal variant” ventricular repolarisation abnormalities such as BER. These secondary repolarisation abnormalities produce concordant ST segment and T wave changes with a narrow QRS-T wave angle. On the other hand, T wave inversion as a result of primary repolarisation abnormalities such as ischaemia or infarction produces a widened QRS-T wave angle.
In our patient above, the QRS axis is about +75 degrees and T wave axis +110 degrees, producing a QRS-T wave angle of 45 degrees with resultant concordance in aVL. This suggests T-wave inversion in aVL is simply normal repolarisation secondary to position of the heart.
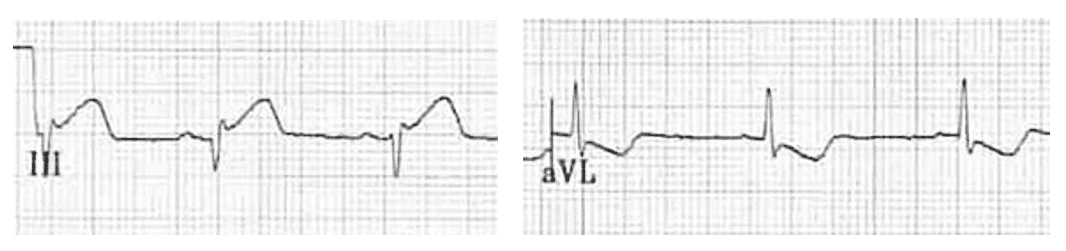
Conversely, a wide angle between QRS and T wave axes cannot be explained without a primary pathology. In the absence of conduction delay (e.g. bundle branch block), a positive QRS complex in aVL with concurrent T wave inversion is likely to be an abnormal finding, and suggests pathological T wave inversion due to ischaemia.
Take a look at the QRS-T wave angle in this example of inferior MI
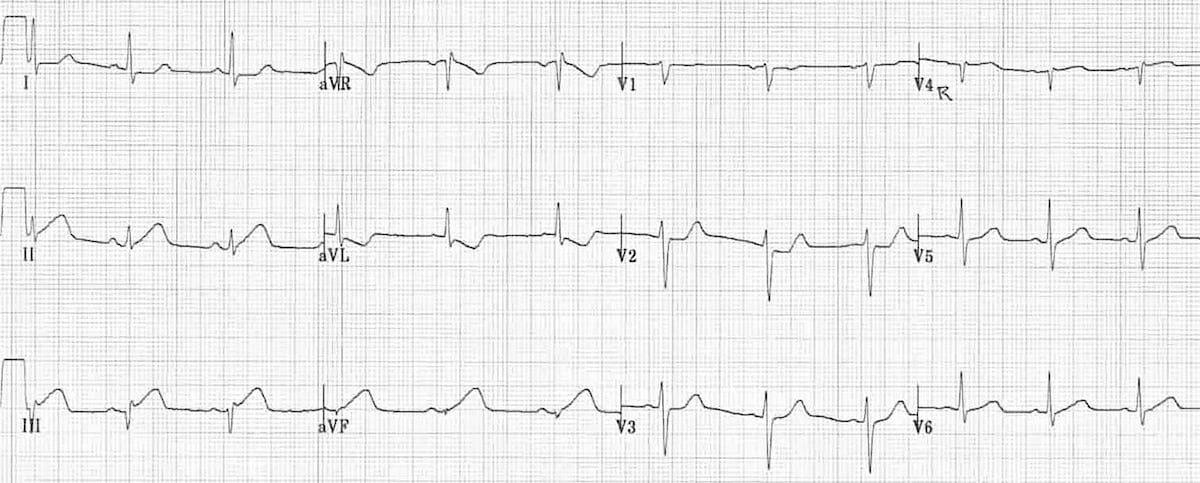
Evolving inferior occlusion myocardial infarction (OMI):
- Hyperacute T waves in inferior leads, with evolving ST elevation and Q wave formation
- Reciprocal ST depression and T wave inversion in aVL follows a normal QRS complex, with a wide QRS-T wave angle
- QRS axis is -15 degrees, and T wave axis +75 degrees, giving a QRS-T wave angle of 90 degrees
ST elevation and hyperacute T waves in ischaemia: “Proportion is everything”
Note the difference in inferior QRS complex amplitude between our with patients with BER and inferior OMI. When assessing the magnitude of ST elevation and size of “hyperacute” T waves in suspected infarction, the size of the preceding QRS complex must be taken into account. Let’s compare our two examples:
ECG 1: BER

- Large amplitude QRS complexes, reaching 25mm in frontal leads
- Maximal ST elevation is 2mm, giving an ST/QRS ratio of 8%
- Inferior T waves are large amplitude at 6mm but appear in proportion to the preceding QRS complex (this ratio can also be assessed)
- All ST segment changes and T waves are concordant to the preceding QRS complex, yielding a narrow QRS-T wave angle
ECG 2: Inferior OMI
- Maximal frontal QRS amplitude is 8mm in lead I
- Maximal ST elevation is also 2mm, this time with an ST/QRS ratio of 25%
- Inferior T waves tower are similar amplitude at 5mm, but appear to tower over the preceding QRS complex. Associated loss of R wave height inferiorly produces a widened QRS-T wave angle
What about the inferior Q waves?
These are simply a result of orientation once again. In the most common “normal” ECG, we see small Q waves in V5-6 that result from normal left to right depolarisation of the interventricular septum. If the heart is more vertically orientated, inferior leads, in particular II and aVF, will fall at an angle of 90 degrees or more to this depolarisation vector with resultant small Q waves. Their small amplitude and narrow width are not concerning for infarction Q waves.
- T wave inversion in aVL can be a normal finding. The QRS-T wave angle can assist in differentiating primary versus secondary repolarisation abnormalities
- There is no single criteria for diagnosing BER in the presence of ST elevation. Large voltage QRS complexes, a low ST-QRS ratio, and a narrow QRS-T wave angle here point towards a benign cause in this young patient.
- The degree of ST elevation and “hyperacute” nature of T waves should be measured in proportion to the preceding QRS complex. Wide, bulky T waves that tower over low voltage preceding QRS complexes suggest evolving infarction
Further reading
Related topics
Expert Review
- Smith SW. A female in her 60s who was lucky to get expert ECG interpretation. Dr Smith’s ECG Blog. 2018 February
TOP 150 ECG Series

MBBS (UWA) CCPU (RCE, Biliary, DVT, E-FAST, AAA) Adult/Paediatric Emergency Medicine Advanced Trainee in Melbourne, Australia. Special interests in diagnostic and procedural ultrasound, medical education, and ECG interpretation. Editor-in-chief of the LITFL ECG Library. Twitter: @rob_buttner
Interventional cardiologist, ECG and hemodynamics fan. MD, Assoc. Prof. at Marmara University, Pendik T&R Hospital, Assoc. Editor at Archives of TSC, ESC National Prevention Coordinator
Is transient coronary spasm a possibility?